SPOTLIGHT
Black & Hispanic Communities in Forgotten Middle Disproportionately Represented in Lowest Bracket of Financial Resources
Authors:
Client:
The SCAN Foundation
February 2024
NORC’s Health Care Strategy team took a deep dive into the financial disparities across racial and ethnic groups among middle-income older adults. We found that while the middle-income older adult population is becoming increasingly racially and ethnically diverse, Black and Hispanic groups are disproportionately represented in the lowest bracket of financial resources.
For over five years, NORC has been at the forefront of research focused on the Forgotten Middle, a term we coined in our landmark 2019 study to define middle-income older adults who are unlikely to qualify for Medicaid long-term care and do not have the financial resources to pay for certain housing and care supports. Since then, we have produced an updated national study with more recent data and designed a Forgotten Middle model specifically for California’s middle-income older adults.
Each analysis forecasts the size, demographics, health needs, and financial resources of the middle-income older adult population. Our cumulative research has projected an impending crisis without a clear policy solution: a majority of middle-income older adults will be unlikely to afford needed care and housing in the next decade, potentially challenging their ability to age with dignity, choice, and independence.
The Forgotten Middle is not a homogeneous population, and we were particularly interested in understanding how financial resources might differ across racial and ethnic groups. Existing literature suggests that Black and Hispanic older adults in particular may face distinct economic and health care access challenges that impact their ability to age well. With support from The SCAN Foundation, we used Health and Retirement Study (HRS) data from 2020 to analyze financial disparities among marginalized and minoritized racial groups.
We found that the middle-income older adult population is becoming more racially and ethnically diverse than ever. In 2020, older adults of color—defined using the HRS as Black, Hispanic, and “Other”—represented 12 percent of the middle-income group; by 2035, older adults of color will comprise nearly 25 percent of this group. As defined in the HRS, the “Other” racial group comprises all races/ethnicities other than Black, Hispanic, and white, including American Indian, Alaskan Native, Asian, Native Hawaiian, and Pacific Islander Asian, as well as individuals who identify as multiracial. The largest shift in composition is among Hispanics, who will comprise nearly 11 percent of the middle-income group in 2035—nearly a three-fold increase from 2020.
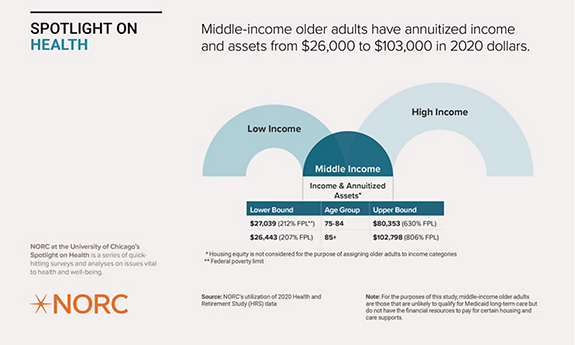
To understand differences in financial situation across racial groups, we looked at middle-income older adults’ total financial resources by quartile. Total financial resources consist of income and annuitized assets but do not include a primary residence, consistent with the general Medicaid treatment of assets for eligibility (see the Methodology section for our reasoning).
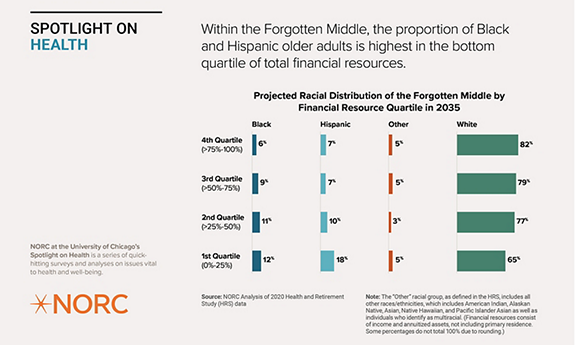
There is growing ethnic and racial diversity in the middle-income 75+ population in the United States. However, within the middle market, the highest percentage of Black and Hispanic older adults is found within the lowest quartile of financial resources.
White older adults comprise 82 percent of the top quartile of income and asset distribution within the middle market, which is disproportionately higher than the middle-income older adult population distribution. In contrast, 35 percent of the bottom quartile are older adults of color, disproportionately higher than the expected middle-income population as a whole.
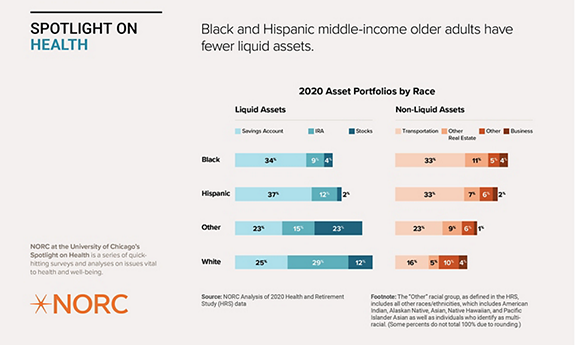
Black and Hispanic older adults tend to hold fewer liquid assets than white older adults. Holding fewer liquid assets makes it more difficult to access the housing and care options that align with their preferences.
In addition to total financial resources, we analyzed the asset portfolios of the middle-income older adult population. For this analysis, asset portfolios include stocks, retirement accounts or IRAs, savings accounts, transportation, real estate beyond primary residences, and businesses. Middle-income older adults who do not qualify for Medicaid often must rely on other sources of income, such as pensions or retirement accounts, to afford the care and housing options they need or want.
Having more liquid assets, or assets that can be converted into cash quickly, can make affording housing and health care easier for older adults. In contrast, 33 percent of Black and Hispanic older adults’ asset portfolios comprise transportation items like a personal vehicle. Liquidizing a vehicle is both inconvenient and impractical as it eliminates a source of independence in a society increasingly dependent on private vehicle access.
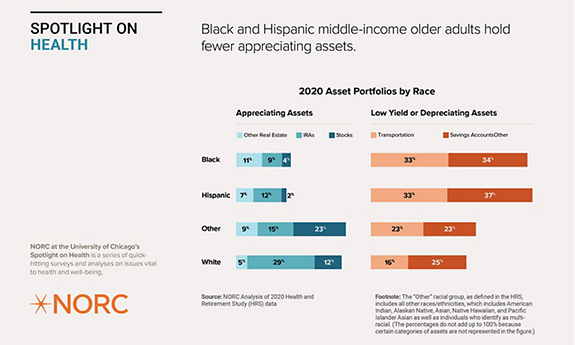
Within the middle market, Black and Hispanic older adults hold a larger proportion of their portfolio in low-yield or depreciating assets like savings accounts and transportation, while white and “Other” older adults hold a larger proportion of their portfolio in appreciating assets.
Beyond liquidity, we looked at the types of assets based on their potential future value. Appreciating assets, like stocks, retirement accounts, and real estate, will likely grow in value over time, providing additional financial resources for older adults as they age. Black and Hispanic older adults have far less of their asset portfolio in appreciating assets, with over two-thirds of their portfolios being low-yield or depreciating assets.
Retirement accounts make up substantially less of Black and Hispanic older adults’ portfolios compared to white older adults. Research finds that workers of color are less likely to have access to employer-sponsored retirement accounts, which results in fewer savings in retirement years and limits the ability to pay for housing and health care.
This closer look at the financial resources across racial groups in the Forgotten Middle highlights the impending crisis our research has identified—many middle-income older adults, particularly Black and Hispanic older adults, are unlikely to afford needed care and housing options in the next decade, potentially challenging their ability to age with dignity, choice, and independence.
Methodology
This Spotlight draws upon a larger analysis that examines the differences in finances, housing, and family structures among older adults by race and explores aging challenges among rural older adults through case studies and existing literature.
This analysis relies on 2020 Health and Retirement Study (HRS) data. We examined individuals who were 60 and older in 2020, since they will be 75 or older in 2035, allowing us to project future trends in the broader analysis. We looked at demographic, health, and financial attributes of this group, with data stratified by race (Black, Hispanic, “Other,” white) to identify trends and project future trends among older adults in historically marginalized and minoritized communities.1 All key findings presented were tested and found to be statistically significant (p<.05) using SAS survey procedures and HRS complex sampling design. NORC used a combination of two-sample t-tests and Chi-squared tests of distributions where appropriate.
This analysis uses race and ethnicity groups from the HRS. The “Other” racial group, as defined in the HRS, includes all other races/ethnicities, which includes American Indian, Alaskan Native, Asian, Native Hawaiian, and Pacific Islander Asian, as well as individuals who identify as multiracial.
Consistent with our previous Forgotten Middle methodology, we do not include primary residence as an asset, in alignment with Medicaid asset tests. Home equity is also considered separate as some individuals may be reluctant to sell their home or may have a spouse who continues to live in the home.
1 This analysis uses the term historically marginalized and minoritized groups to describe the overall study population in alignment with equitable language guidance, such as that from government agencies, medical associations, and academic institutions. The term historically marginalized and minoritized acknowledges that power structures actively marginalize certain groups, even if those groups may be the majority in some scenarios.
Project Background
This analysis was conducted as part of a larger project with The SCAN Foundation. The SCAN Foundation commissioned the Health Care Strategy team at NORC to conduct an examination of the financial resources among historically marginalized and minoritized middle-income older adults in the United States. For additional information on the research design and estimation procedures, please email rayel-sarah@norc.org.
