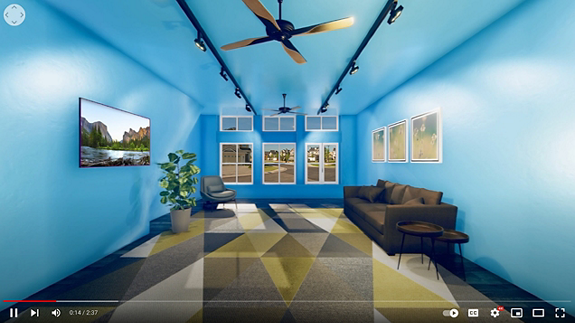
Virtual Reality Video: Income and Housing in America

October 2018
This virtual reality video allows users to experience differences in U.S. house sizes by region and demographics.
Using data from the U.S. Census Bureau and the 2015 Residential Energy Consumption Survey, NORC employed virtual reality (VR) technology to illustrate differences in income and housing across the country based on regional and demographic characteristics.
Viewers can fully immerse themselves in the experience, hearing, seeing, and “feeling” the data in a new way by using the pan button in the upper left-hand corner of the video (desktop), a VR viewer, or making slight directional adjustments to the positioning of an iPhone or Android mobile phone.

This visualization was created by NORC’s VizStudio, a creative community of experts who turn complex data into compelling visual stories.


